
Note
Click here to download the full example code
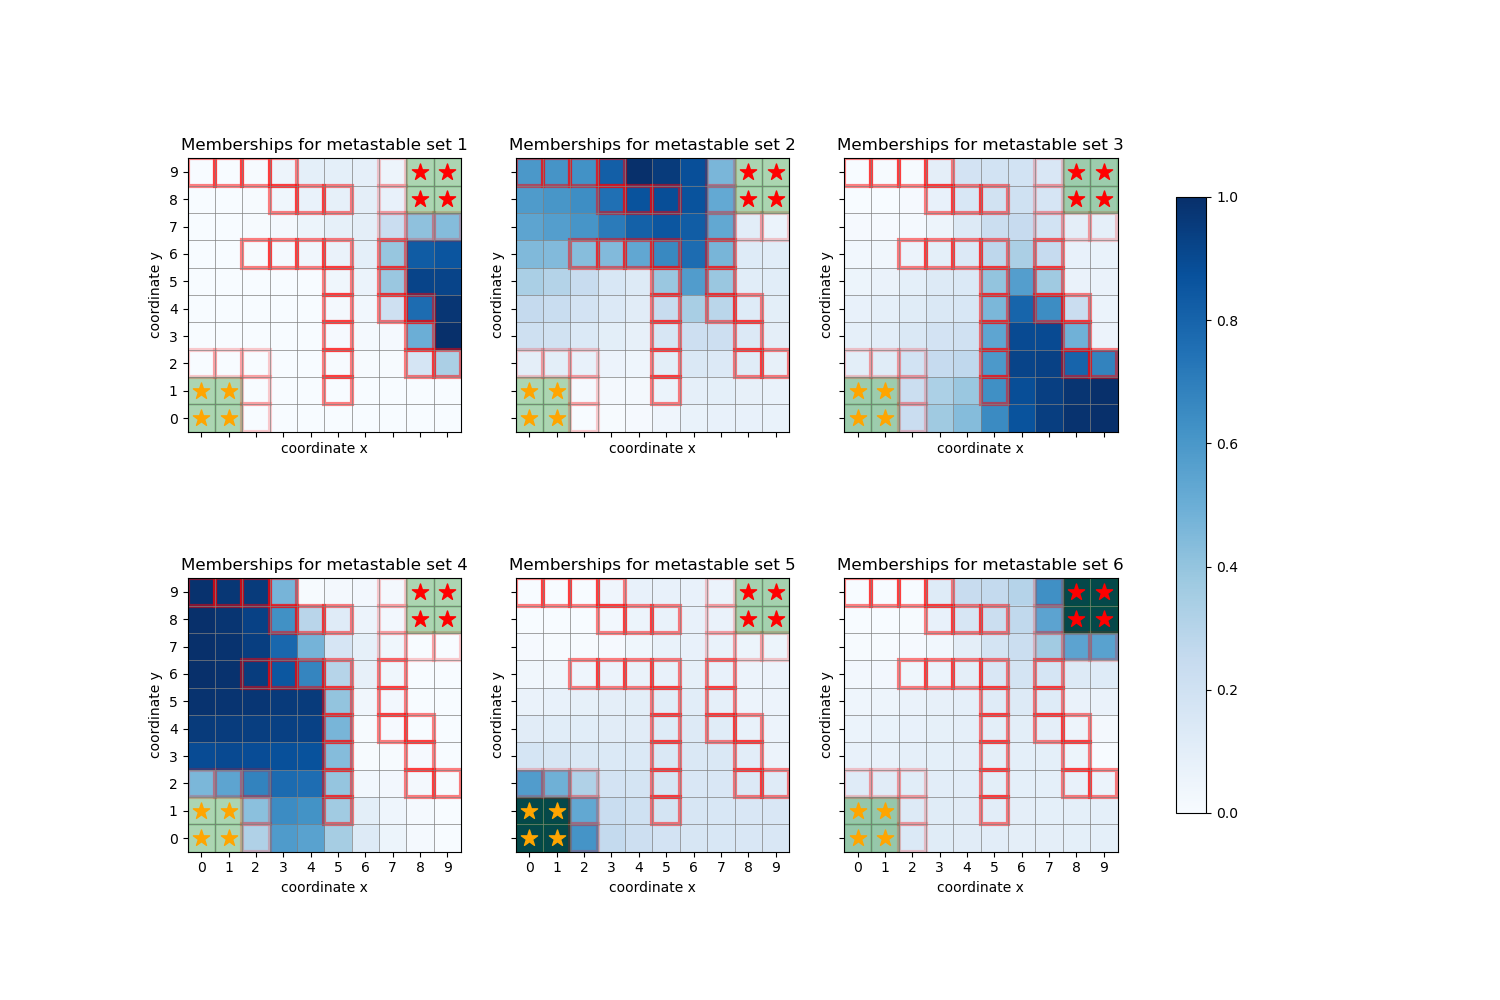
PCCA+ on the Drunkard’s walk
This example shows a decomposition into metastable sets (see deeptime.markov.pcca()) of states
in the deeptime.data.drunkards_walk() example.
The state assignments are shown via their probability distributions over the micro states.
 9 import matplotlib as mpl
10 import matplotlib.pyplot as plt
11
12 from deeptime.data import drunkards_walk
13
14 sim = drunkards_walk(grid_size=(10, 10),
15                      bar_location=[(0, 0), (0, 1), (1, 0), (1, 1)],
16                      home_location=[(8, 8), (8, 9), (9, 8), (9, 9)])
17 sim.add_barrier((5, 1), (5, 5))
18 sim.add_barrier((0, 9), (5, 8))
19 sim.add_barrier((9, 2), (7, 6))
20 sim.add_barrier((2, 6), (5, 6))
21
22 sim.add_barrier((7, 9), (7, 7), weight=5.)
23 sim.add_barrier((8, 7), (9, 7), weight=5.)
24
25 sim.add_barrier((0, 2), (2, 2), weight=5.)
26 sim.add_barrier((2, 0), (2, 1), weight=5.)
27
28 pcca = sim.msm.pcca(6)
29
30 fig, axes = plt.subplots(2, 3, figsize=(15, 10), sharex=True, sharey=True)
31
32 for i, ax in enumerate(axes.flatten()):
33     ax.set_title(f"Memberships for metastable set {i + 1}")
34     handles, labels = sim.plot_2d_map(ax, barrier_mode='hollow')
35
36     Q = pcca.memberships[:, i].reshape(sim.grid_size)
37     cb = ax.imshow(Q, interpolation='nearest', origin='lower', cmap=plt.cm.Blues)
38 norm = mpl.colors.Normalize(vmin=0, vmax=1)
39 fig.colorbar(plt.cm.ScalarMappable(norm=norm, cmap=plt.cm.Blues), ax=axes, shrink=.8)
Total running time of the script: ( 0 minutes 2.057 seconds)
Estimated memory usage: 8 MB