
function plot_markov_model
- deeptime.plots.plot_markov_model(msm: MarkovStateModel | ndarray, pos=None, state_sizes=None, state_scale=1.0, state_colors='#ff5500', state_labels='auto', minflux=1e-06, edge_scale=1.0, edge_curvature=1.0, edge_labels='weights', edge_label_format='{:.2e}', ax=None, **textkwargs)
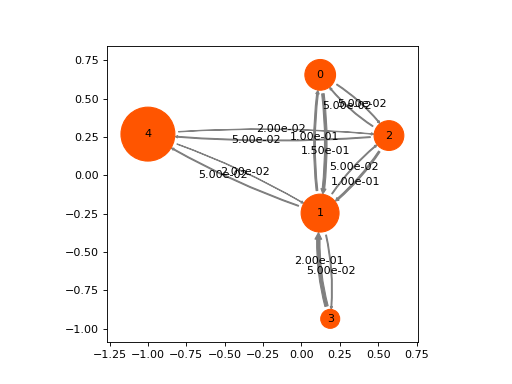
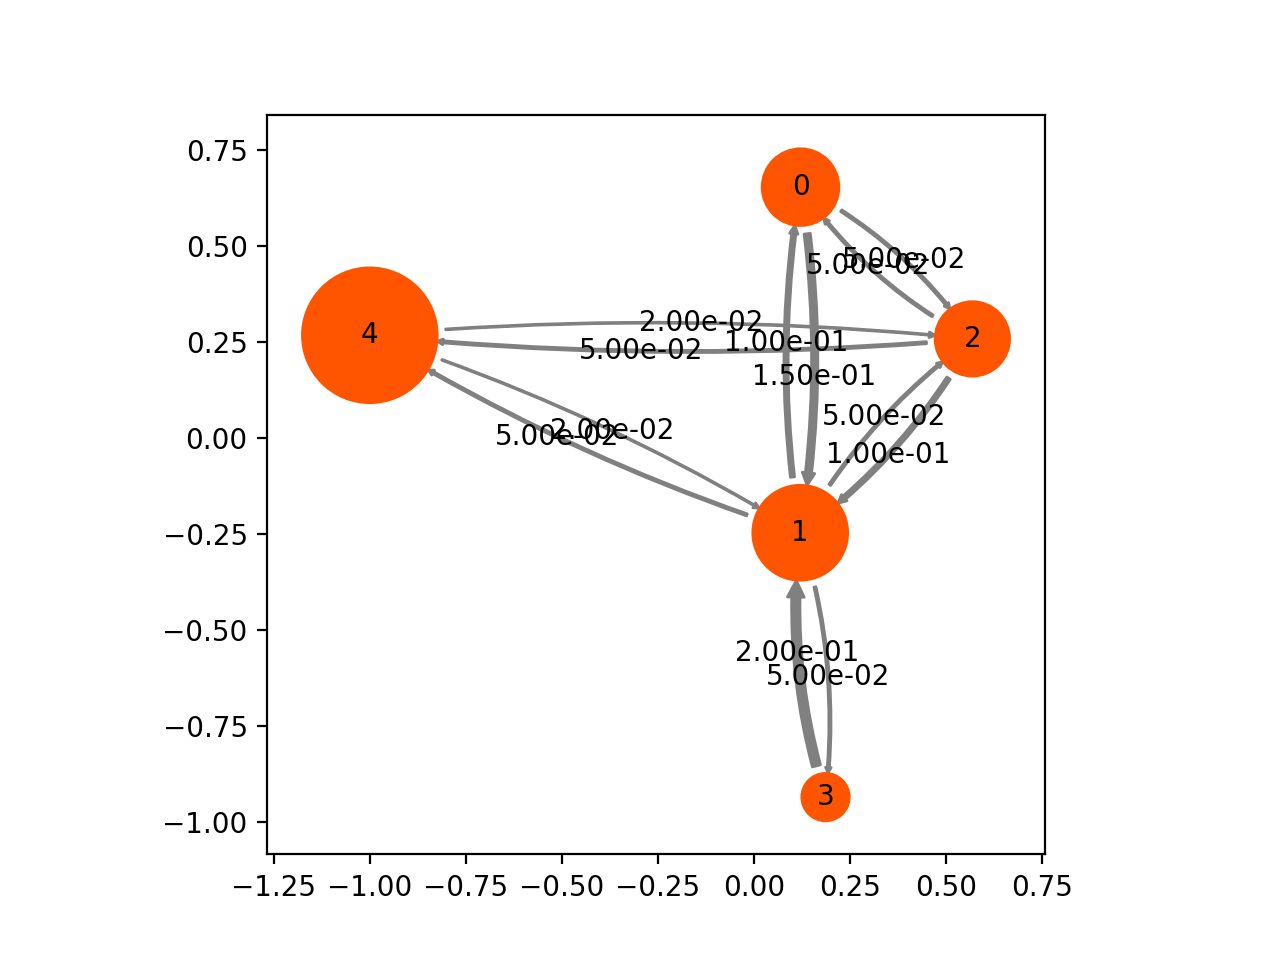
Network representation of MSM transition matrix.
This visualization is not optimized for large matrices. It is meant to be used for the visualization of small models with up to 10-20 states, e.g., obtained by a HMM coarse-graining. If used with large network, the automatic node positioning will be very slow and may still look ugly.
(
Source code,png,hires.png,pdf)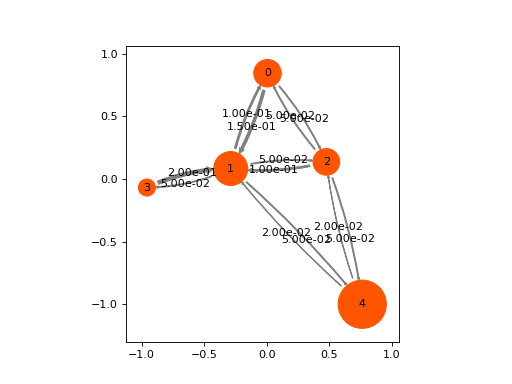
- Parameters:
msm (MarkovStateModel or ndarray) – The Markov state model to plot. Can also be the transition matrix.
pos (ndarray(n,2) or dict, optional, default=None) – User-defined positions to draw the states on. If not given, will try to place them automatically. The output of networkx layouts can be used for this argument.
state_sizes (ndarray(n), optional, default=None) – User-defined areas of the discs drawn for each state. If not given, the stationary probability of P will be used.
state_colors (string, ndarray(n), or list, optional, default='#ff5500' (orange)) –
- string :
a Hex code for a single color used for all states
- array :
n values in [0,1] which will result in a grayscale plot
- list :
of len = nstates, with a color for each state. The list can mix strings, RGB values and hex codes, e.g.
state_colors= [‘g’, ‘red’, [.23, .34, .35], ‘#ff5500’] is possible.
state_labels (list of strings, optional, default is 'auto') – A list with a label for each state, to be displayed at the center of each node/state. If left to ‘auto’, the labels are automatically set to the state indices.
minflux (float, optional, default=1e-6) – The minimal flux (p_i * p_ij) for a transition to be drawn
edge_scale (float, optional, default=1.0) – Relative arrow scale. Set to a value different from 1 to increase or decrease the arrow width.
edge_curvature (float, optional, default=1.0) – Relative arrow curvature. Set to a value different from 1 to make arrows more or less curved.
edge_labels ('weights', None or a ndarray(n,n) with label strings. Optional, default='weights') – Strings to be placed upon arrows. If None, no labels will be used. If ‘weights’, the elements of P will be used. If a matrix of strings is given by the user these will be used.
edge_label_format (str, optional, default='{2.e}') – The numeric format to print the arrow labels.
ax (matplotlib Axes object, optional, default=None) – The axes to plot to. When set to None a new Axes (and Figure) object will be used.
textkwargs (optional argument for the text of the state and arrow labels.) – See https://matplotlib.org/stable/api/text_api.html for more info. The parameter ‘size’ refers to the size of the state and arrow labels and overwrites the matplotlib default. The parameter ‘arrow_label_size’ is only used for the arrow labels; please note that ‘arrow_label_size’ is not part of matplotlib.text.Text’s set of parameters and will raise an exception when passed to matplotlib.text.Text directly.
- Returns:
ax, pos – An axes object containing the plot and the positions of states. Can be used later to plot a different network representation (e.g. the flux)
- Return type:
matplotlib.axes.Axes, ndarray(n,2)