
function plot_adjacency
- deeptime.plots.plot_adjacency(adjacency_matrix, positions: ndarray | None = None, layout=None, ax=None, scale_states=True)
Plot an adjacency matrix. The edges are scaled according to the respective values. For more fine-grained control use
Network.(
Source code,png,hires.png,pdf)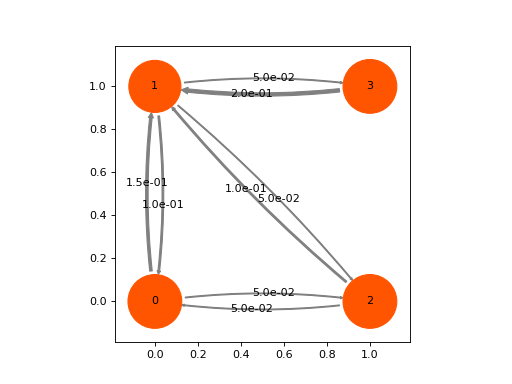
- Parameters:
adjacency_matrix (ndarray or scipy sparse matrix) – Adjacency matrix to plot. Could be, e.g., a MSM transition matrix.
positions (ndarray, optional, default=None) – A (N, 2)-shaped ndarray containing positions for the nodes of the adjacency matrix. If left as None, the layout is algorithmically determined (based on the algorithm specified in the layout parameter).
layout (callable, optional, default=None) – The automatic layout to use. Only has an effect, if positions is None. In that case, it defaults to the networkx.spring_layout. Can be any callable which takes a networkx graph as first argument and yields a position array or dict.
ax (matplotlib.axes.Axes, optional, default=None) – The axes to plot on. Otherwise, uses the current axes (via plt.gca()).
scale_states (bool, default=True) – Whether to scale nodes according to the value on the diagonal of the adjacency matrix.
- Returns:
ax – The axes that were plotted on.
- Return type:
matplotlib.axes.Axes
See also