
function plot_ck_test
- deeptime.plots.plot_ck_test(data: ChapmanKolmogorovTest, height=2.5, aspect=1.0, conf: float = 0.95, color=None, grid: CKTestGrid = None, legend=True, xlabel='lagtime (steps)', ylabel='probability', y01=True, sharey=True, **plot_kwargs)
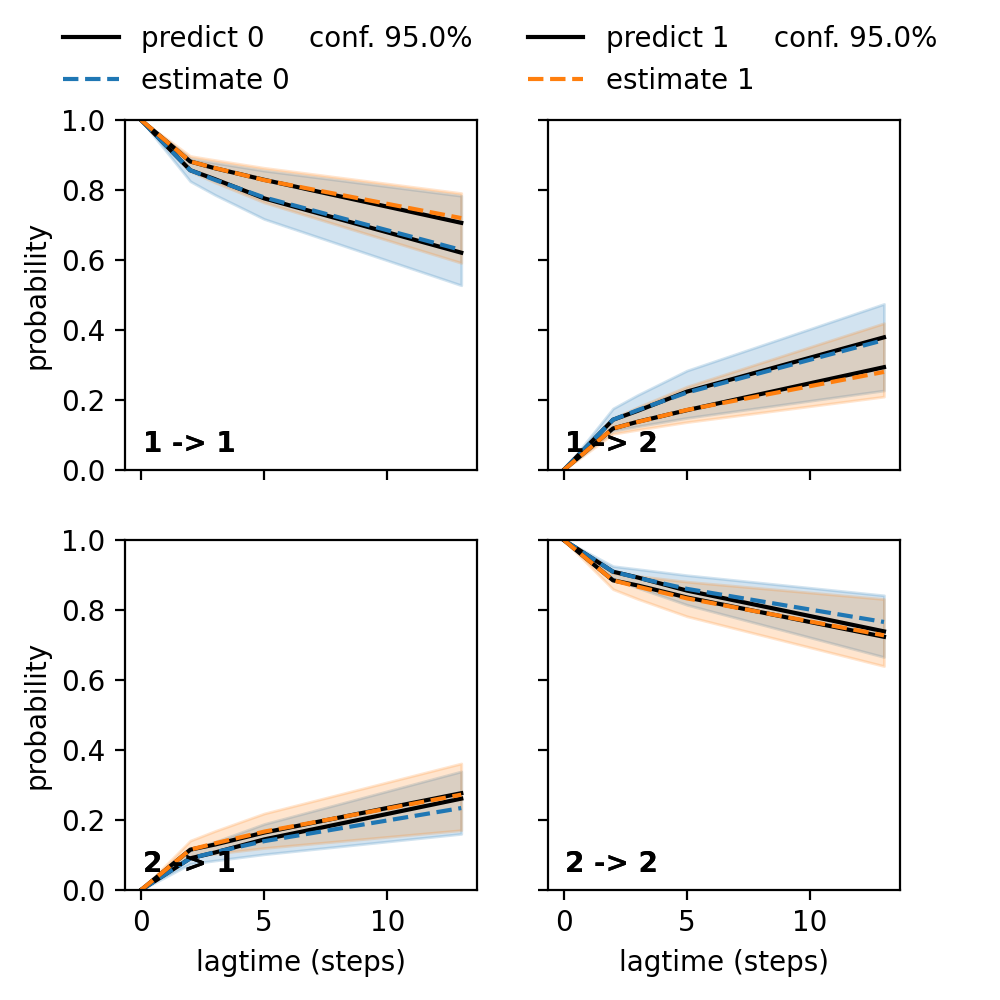
Plot the Chapman Kolmogorov test.
(
Source code,png,hires.png,pdf)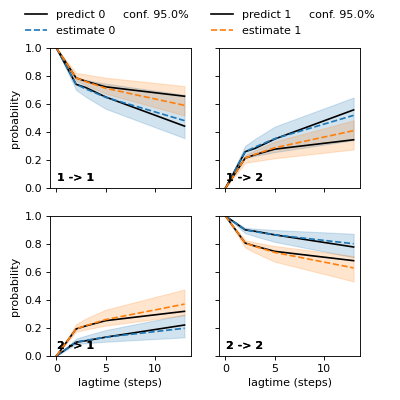
- Parameters:
data (ChapmanKolmogorovTest) – Result of
ck_test.height (float, default=2.5) – Figure height.
aspect (float, default=1.) – Aspect of individual plots.
conf (float, default=0.95) – Confidence interval probability.
color (color, optional, default=None) – The color to use for predictions. Per default uses default colors.
grid (CKTestGrid, optional, default=None) – An already existing grid view of a ck-test to overlay.
legend (bool, optional, default=True) – Whether to plot a legend.
xlabel (str, default='lagtime (steps)') – The x label.
ylabel (str, default='probability') – The y label.
y01 (bool, optional, default=True) – Sets the limits of the y-axis to [0, 1].
sharey (bool, optional, default=True) – Whether to share the y-axes in case a new grid is created.
**plot_kwargs – Further optional keyword arguments that go into ax.plot.
- Returns:
Object containing the CK test grid view.
- Return type:
grid