
function plot_contour2d_from_xyz
- deeptime.plots.plot_contour2d_from_xyz(x, y, z, n_bins=100, method='nearest', contourf_kws=None, ax=None)
Plot a two-dimensional contour map based on an interpolation over unordered data triplets \((x, y)\mapsto z\).
(
Source code,png,hires.png,pdf)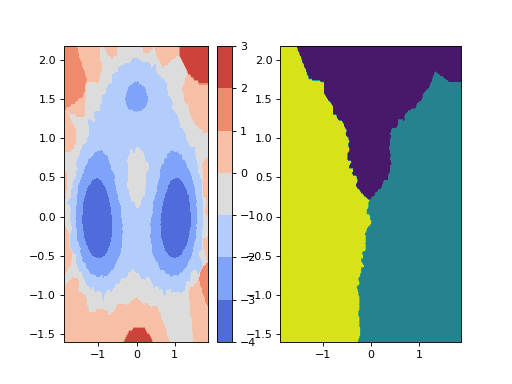
- Parameters:
x (ndarray) – Sample $x$ coordinates as array of shape (T,).
y (ndarray) – Sample $y$ coordinates as array of shape (T,).
z (ndarray) – Sample $z$ values as array of shape (T,).
n_bins (int, optional, default=100) – Resolution of the two-dimensional histogram.
method (str, default='nearest') – Interpolation method. See
scipy.interpolate.griddata().contourf_kws (dict, optional, default=None) – dict of optional keyword arguments for matplotlib.contourf. Per default empty dict.
ax (matplotlib.Axes, optional, default=None) – axes to plot onto. In case of no provided axes, grabs the matplotlib.gca().
- Returns:
ax (matplotlib.Axes) – Axes onto which the contour was plotted.
mappable – Matplotlib mappable that can be used to create, e.g., colorbars.