
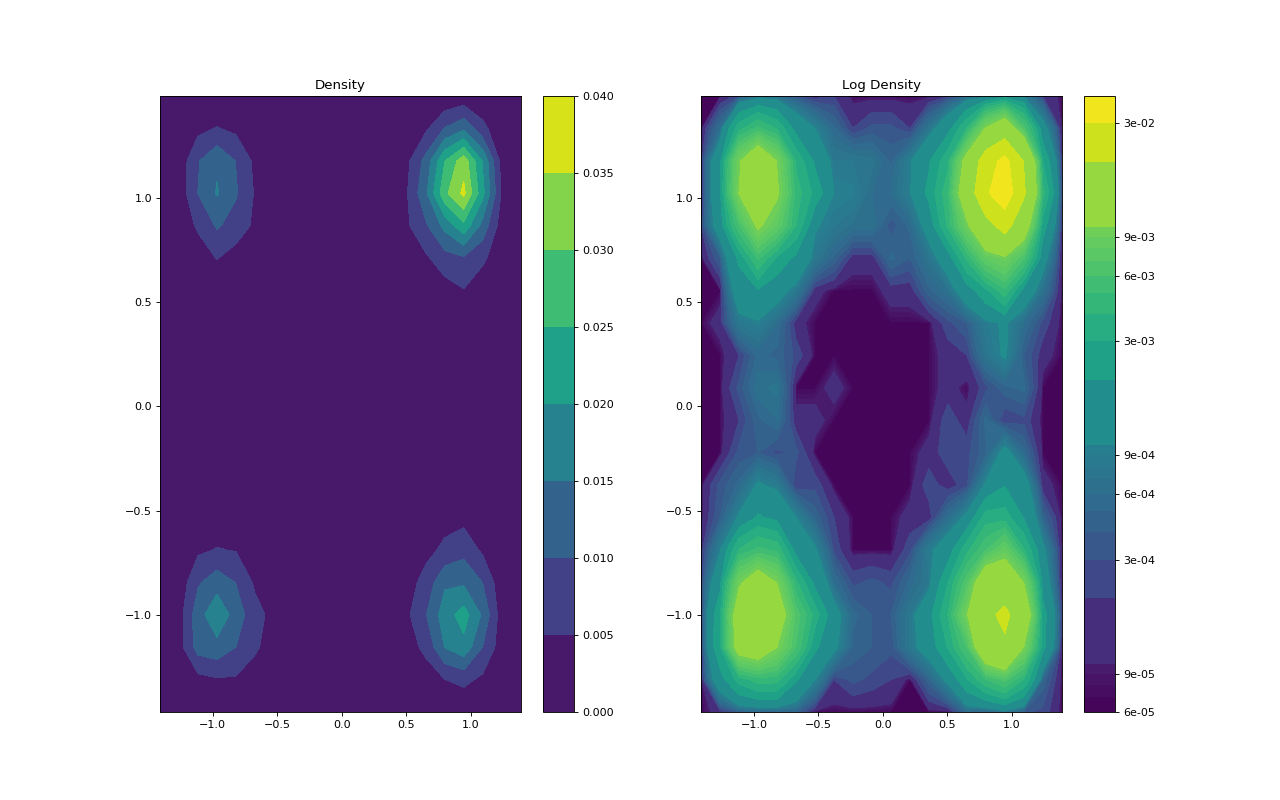
function plot_density
- deeptime.plots.plot_density(x, y, n_bins=100, weights=None, avoid_zero_counts=False, contourf_kws=None, ax=None)
Plot a two-dimensional contour map based on a histogram over unordered data \((x, y)\).
(
Source code,png,hires.png,pdf)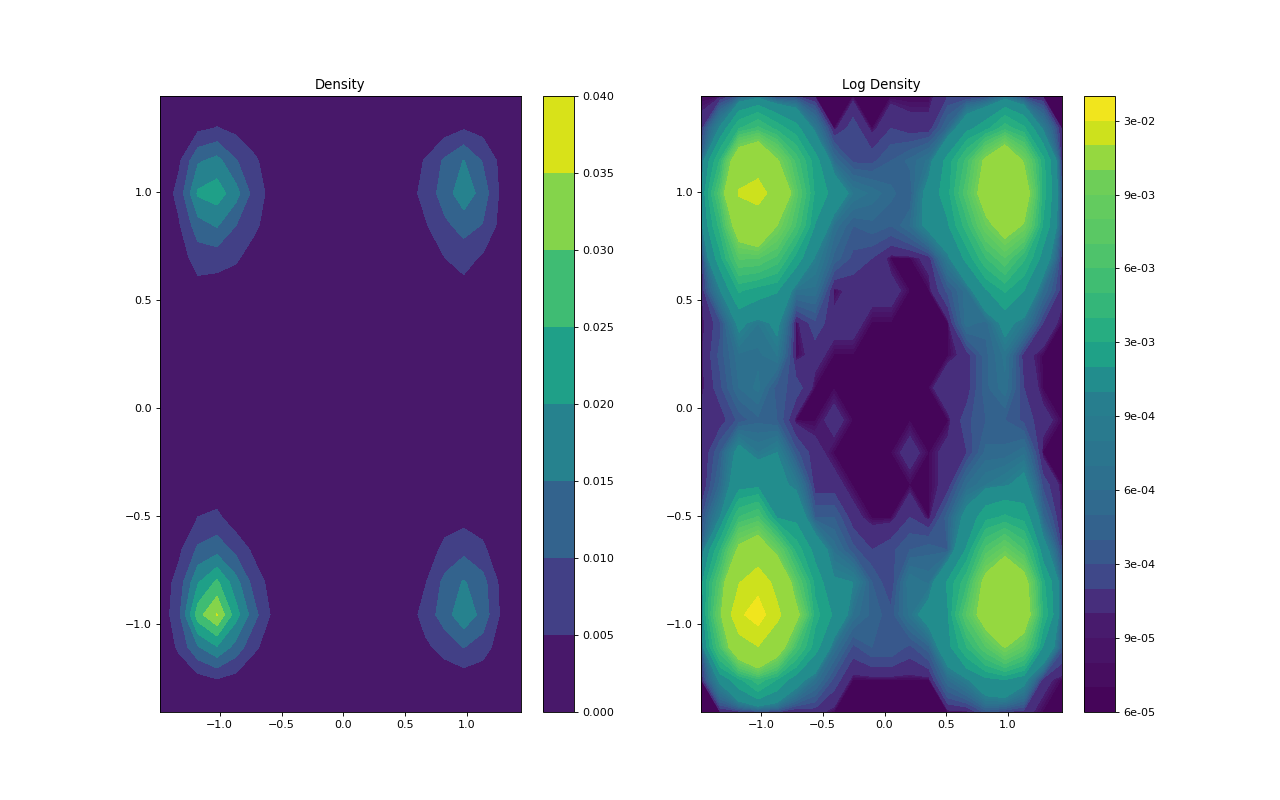
- Parameters:
x (ndarray) – Sample $x$ coordinates as array of shape (T,).
y (ndarray) – Sample $y$ coordinates as array of shape (T,).
n_bins (int, optional, default=100) – Resolution of the two-dimensional histogram.
weights (ndarray(T), optional, default=None) – Sample weights. By default, all samples have the same weight.
avoid_zero_counts (bool, optional, default=False) – Whether to clamp the histogram to its lowest value whenever it is zero. Useful for log-scale plotting.
contourf_kws (dict, optional, default=None) – dict of optional keyword arguments for matplotlib.contourf. Per default empty dict.
ax (matplotlib.Axes, optional, default=None) – axes to plot onto. In case of no provided axes, grabs the matplotlib.gca().
- Returns:
ax (matplotlib.Axes) – Axes onto which the contour was plotted.
mappable – Matplotlib mappable that can be used to create, e.g., colorbars.