Note
Click here to download the full example code
Birth-death chain model
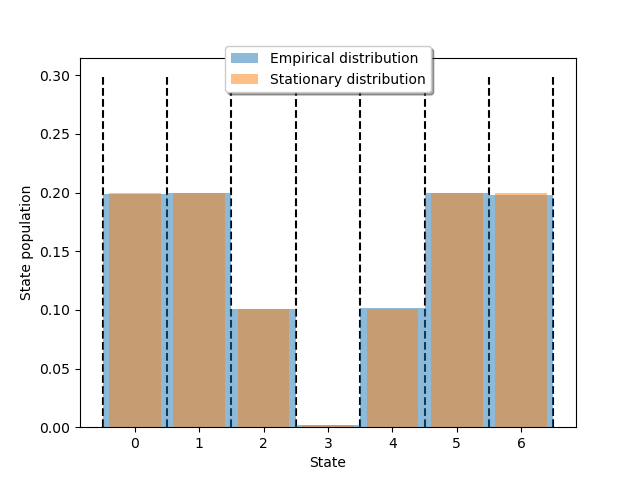
Example for the deeptime.data.birth_death_chain() model.

 8 import numpy as np
 9 import matplotlib.pyplot as plt
10
11 from deeptime.data import birth_death_chain
12
13 n_states = 7
14 b = 2
15 q = np.zeros(n_states)
16 p = np.zeros(n_states)
17 q[1:] = 0.5
18 p[0:-1] = 0.5
19 q[2] = 1.0 - 10 ** (-b)
20 q[4] = 10 ** (-b)
21 p[2] = 10 ** (-b)
22 p[4] = 1.0 - 10 ** (-b)
23
24 bd = birth_death_chain(q, p)
25 dtraj = bd.msm.simulate(100000)
26
27 bins = np.arange(0, dtraj.max() + 1.5) - 0.5
28
29 fig, ax = plt.subplots()
30 ax.set_xticks(bins + 0.5)
31 ax.vlines(bins, ymin=0, ymax=.3, zorder=1, color='black', linestyles='dashed')
32 ax.hist(dtraj, bins, density=True, alpha=.5, color='C0', label='Empirical distribution')
33 ax.bar(np.arange(n_states), bd.stationary_distribution, color='C1', alpha=.5, label='Stationary distribution')
34 ax.set_xlabel('State')
35 ax.set_ylabel('State population')
36 ax.legend(loc='upper center', bbox_to_anchor=(0.5, 1.05), ncol=1, fancybox=True, shadow=True)
37 plt.show()
Total running time of the script: ( 0 minutes 0.361 seconds)
Estimated memory usage: 9 MB
