Note
Click here to download the full example code
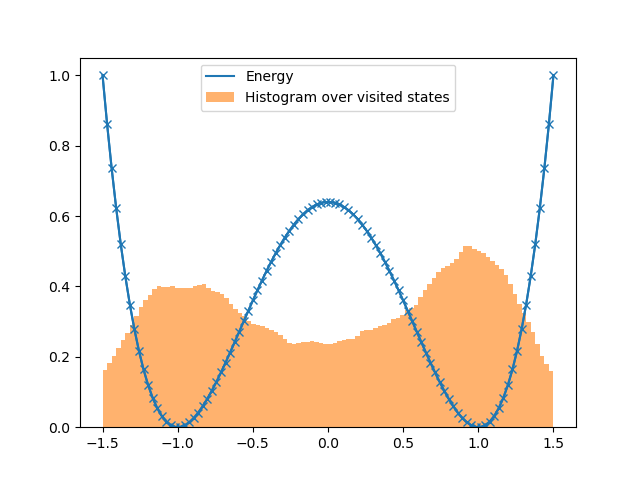
Metropolis chain in 1D energy landscape
Example for deeptime.data.tmatrix_metropolis1d().

 7 import matplotlib.pyplot as plt
 8 import numpy as np
 9
10 from deeptime.data import tmatrix_metropolis1d
11 from deeptime.markov.msm import MarkovStateModel
12
13 xs = np.linspace(-1.5, 1.5, num=100)
14 energies = 1/8 * (xs-1)**2 * (xs+1)**2
15 energies /= np.max(energies)
16 transition_matrix = tmatrix_metropolis1d(energies)
17 msm = MarkovStateModel(transition_matrix)
18
19 traj = msm.simulate(n_steps=1000000)
20
21 plt.plot(xs, energies, color='C0', label='Energy')
22 plt.plot(xs, energies, marker='x', color='C0')
23 plt.hist(xs[traj], bins=100, density=True, alpha=.6, color='C1', label='Histogram over visited states')
24 plt.legend()
25 plt.show()
Total running time of the script: ( 0 minutes 0.820 seconds)
Estimated memory usage: 11 MB
