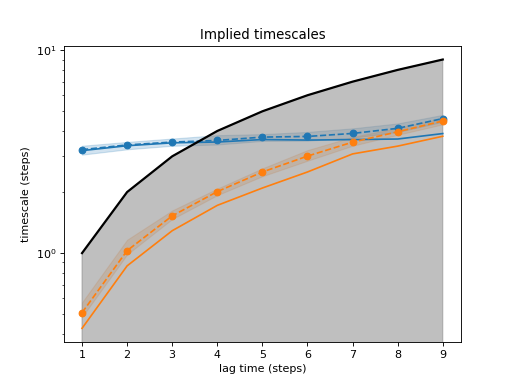
function plot_implied_timescales
- deeptime.plots.plot_implied_timescales(data: ImpliedTimescales, n_its: int | None = None, process: int | None = None, show_mle: bool = True, show_samples: bool = True, show_sample_mean: bool = True, show_sample_confidence: bool = True, show_cutoff: bool = True, sample_confidence: float = 0.95, colors=None, ax=None, **kwargs)
Creates an implied timescales plot inside exising matplotlib axes.
(
Source code,png,hires.png,pdf)
- Parameters:
ax (matplotlib.axes.Axes) – The matplotlib axes to use for plotting.
data (ImpliedTimescales) – A timescales data container object, can be obtained, e.g., via
ImpliedTimescales.from_models().n_its (int, optional, default=None) – Maximum number of timescales to plot.
process (int, optional, default=None) – A particular process to plot. This is mutually exclusive with n_its.
show_mle (bool, default=True) – Whether to show the timescale of the maximum-likelihood estimate.
show_samples (bool, default=True) – Whether to show sample means and/or confidences.
show_sample_mean (bool, default=True) – Whether to show the sample mean. Only has an effect if show_samples is True and there are samples in the data.
show_sample_confidence (bool, default=True) – Whether to show the sample confidence. Only has an effect if show_samples is True and there are samples in the data.
show_cutoff (bool, default=True) – Whether to show the model resolution cutoff as grey filled area.
sample_confidence (float, default=0.95) – The confidence to plot. The default amounts to a shaded area containing 95% of the sampled values.
colors (list of colors, optional, default=None) – The colors that should be used for timescales. By default uses the matplotlib default colors as per rc-config value “axes.prop_cycle”.
**kwargs – Keyword arguments which are forwarded into the matplotlib plotting function for timescales.
- Returns:
ax – The matplotlib axes that were used to plot the timescales.
- Return type:
matplotlib.axes.Axes
See also
ImpliedTimescales
