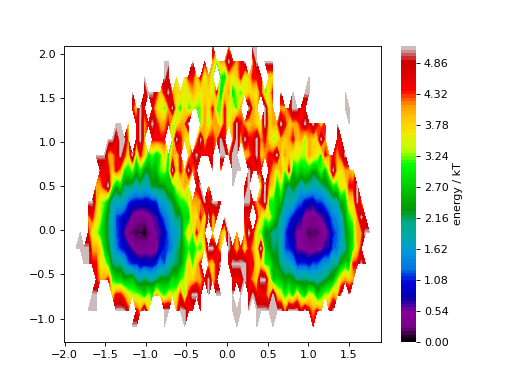
function plot_energy2d
- deeptime.plots.plot_energy2d(energies: EnergyLandscape2d, ax=None, levels=100, contourf_kws=None, cbar=True, cbar_kws=None, cbar_ax=None)
Plot a two-dimensional energy surface. See
deeptime.util.energy2d()to obtain the energy estimation from data.(
Source code,png,hires.png,pdf)
- Parameters:
energies (EnergyLandscape2d) – The estimated energies. Can be obtained via
deeptime.util.energy2d().ax (matplotlib.axes.Axes, optional, default=None) – The axes to plot on. Otherwise, uses the current axes (via plt.gca()).
levels (int, default=100) – Number of contour levels.
contourf_kws (dict, optional, default=None) – Keyword arguments for Axes.contourf.
cbar (bool, optional, default=True) – Whether to draw a color bar.
cbar_kws (dict, optional, default=None) – Keyword arguments for Figure.colorbar.
cbar_ax (matplotlib.axes.Axes, optional, default=None) – The axes to plot the colorbar on. If left to None, take space from the current (or provided) axes.
- Returns:
plot – Plotting object encapsulating references to used axes, colorbars, and contours.
- Return type:
See also
